
SIEM
ASP currently provides Splunk and ELK connection configurations for log queries, Harness Agent investigation, and alert ingestion.
Entry
SIEM settings are located in the SIEM tab of System Settings and include Splunk and ELK subtabs.
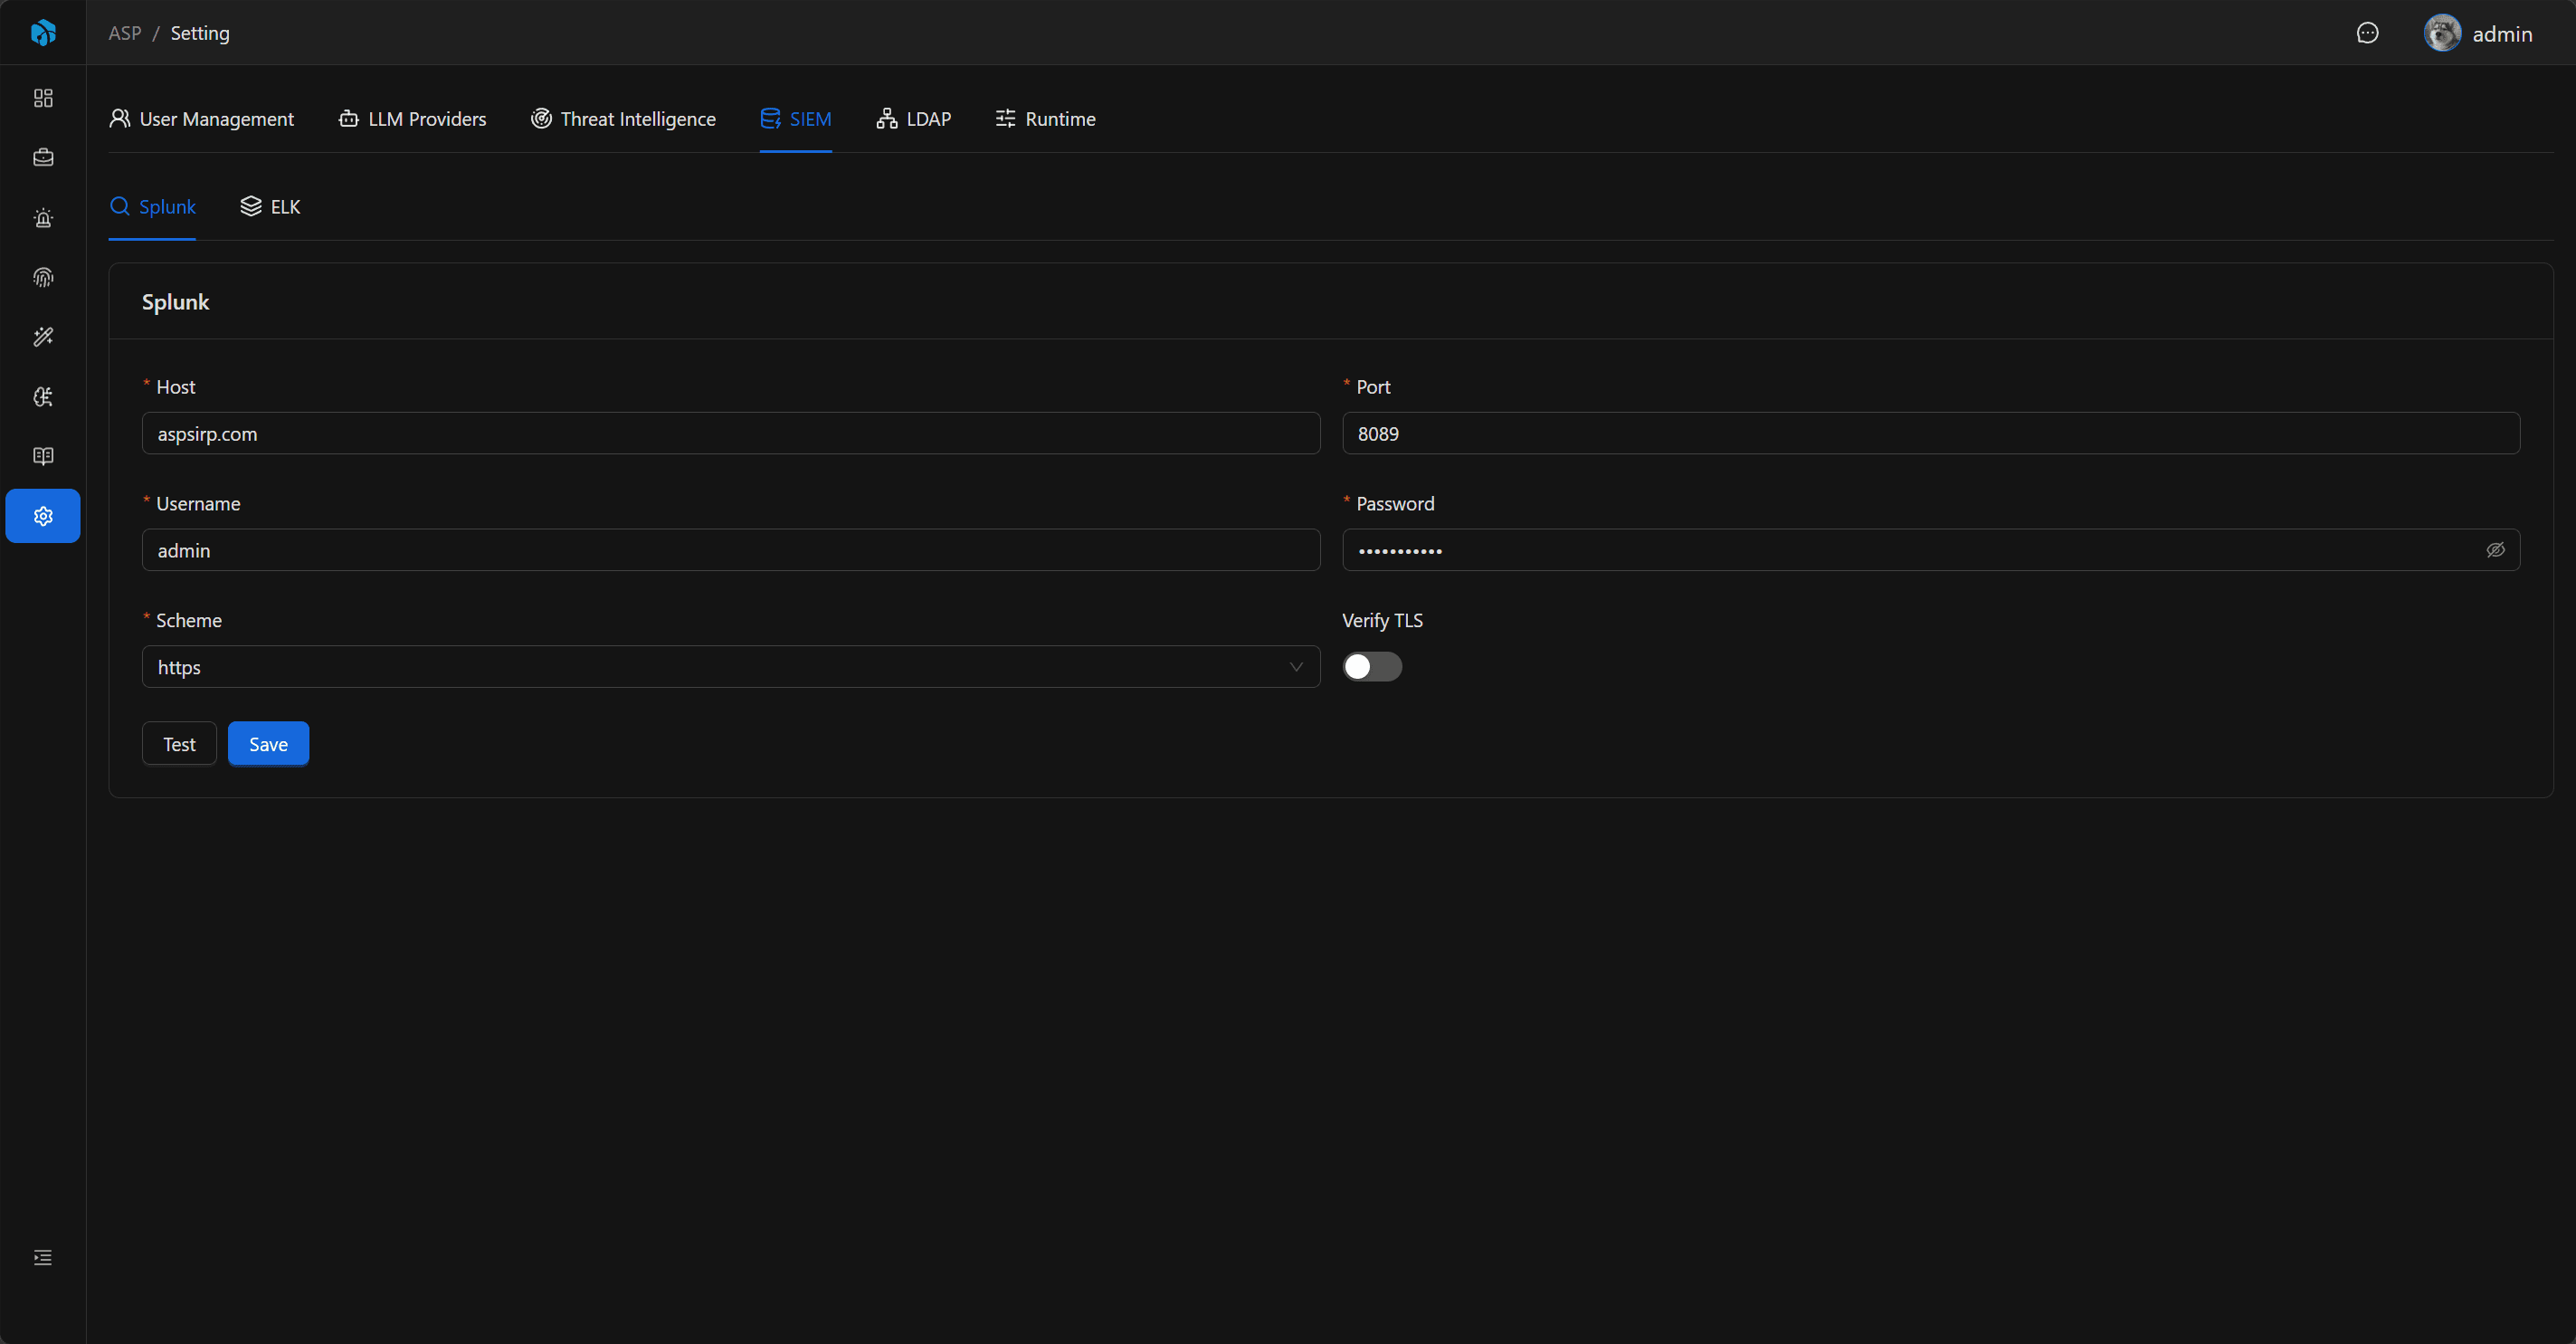
Splunk
Splunk configuration is used to connect to Splunk management interface for SIEM query capabilities.
| Field | Description |
|---|---|
| Host | Splunk server address. |
| Port | Splunk management port, default 8089. |
| Username | Login username. |
| Password | Login password. |
| Scheme | http or https. |
| Verify | Whether to verify certificate. |
After configuration, you can use the test function to verify connection.
ELK
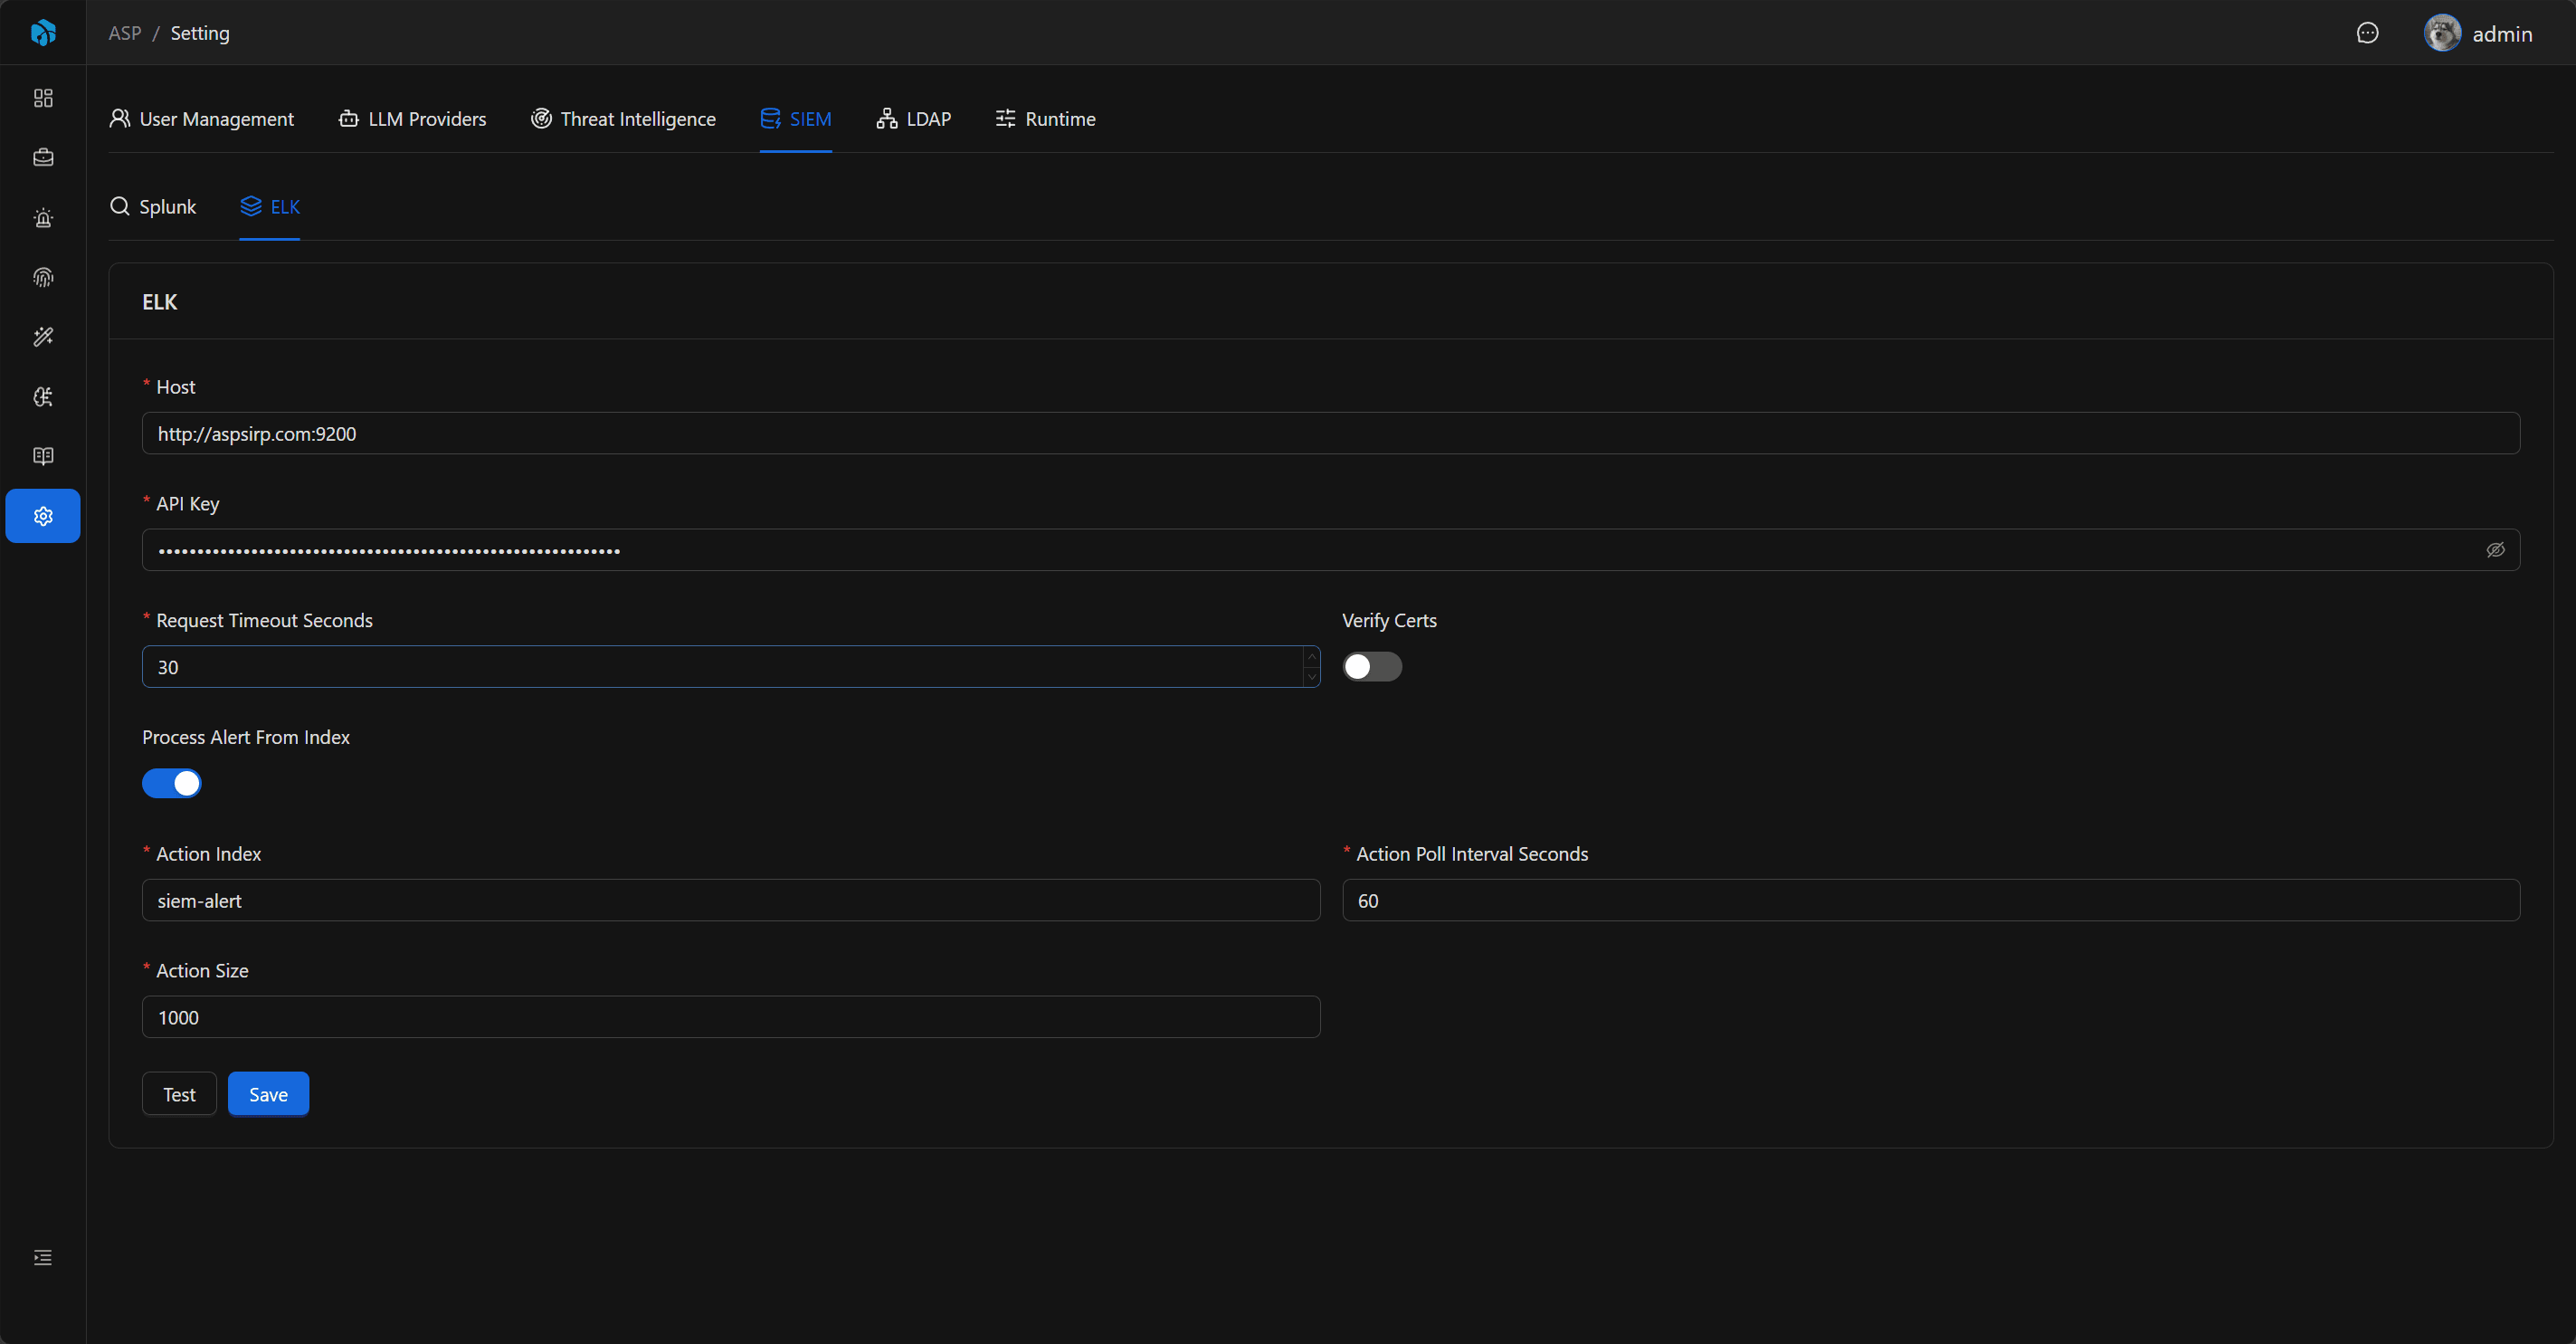
ELK configuration is used to connect to Elasticsearch for SIEM query capabilities and ELK Index Action.
| Field | Description |
|---|---|
| Host | Elasticsearch server address. |
| API Key | Elasticsearch API Key. |
| Verify Certs | Whether to verify certificate. |
| Request Timeout Seconds | Request timeout time. |
| Process Alert From Index Enabled | Whether to enable ELK Index Action polling. |
| Action Index | Index name where Kibana actions are written. |
| Action Poll Interval Seconds | Polling interval. |
| Action Size | Maximum number of actions read per batch. |
Connection Test and Audit
Both Splunk and ELK support Test. Splunk test connects to Splunk and reads service info; ELK test connects to Elasticsearch and reads cluster info.
Saving configuration, testing connection, and revealing keys are all written to Audit Log. Splunk Password and ELK API Key are hidden by default; audit records only record whether a value changed or was revealed, and never store plaintext secrets.
After saving SIEM configuration, the backend refreshes the SIEM client cache so later queries use the latest connection information.
SIEM Query and Index Configuration
SIEM connection configuration is only responsible for providing Splunk / ELK backend credentials. Harness Agent SIEM queries also depend on index configuration in custom\data\siem\*.yaml.
YAML index configuration is used to describe searchable indexes, backend types, field meanings, and default aggregation fields. Unconfigured indexes will not appear in schema list and will not participate in schema-based queries.
ELK Index Action
After enabling Process Alert From Index Enabled, the background worker will read Kibana action documents from Elasticsearch according to configured Action Index, Poll Interval, and Action Size.
Read actions are converted to the Kibana webhook alert processing flow, then continue through ASP alert ingestion and Case / Alert / Artifact generation.
For complete ingestion flow, Kibana action content, and worker execution, see ELK Index Action.
Usage Recommendations
- After saving, first execute Test to confirm network, account, certificate, and key configuration are correct.
- Only enable ELK Index Action when ASP needs to pull alerts from a Kibana action index.
- Maintain
custom\data\siem\*.yamlindex configuration for Harness Agent queries, so LLMs do not blindly search unknown indexes. - For Webhook ingestion, see Alert Ingestion. It is not configured on the SIEM settings page.
Next Steps
- SIEM YAML — Describe Splunk / ELK indexes, fields, and default aggregation fields.
- Alert Ingestion — Configure Splunk Webhook, Kibana Webhook, or ELK Index Action.
- SIEM Search — Let Harness Agents query logs based on SIEM YAML.