
Dashboard
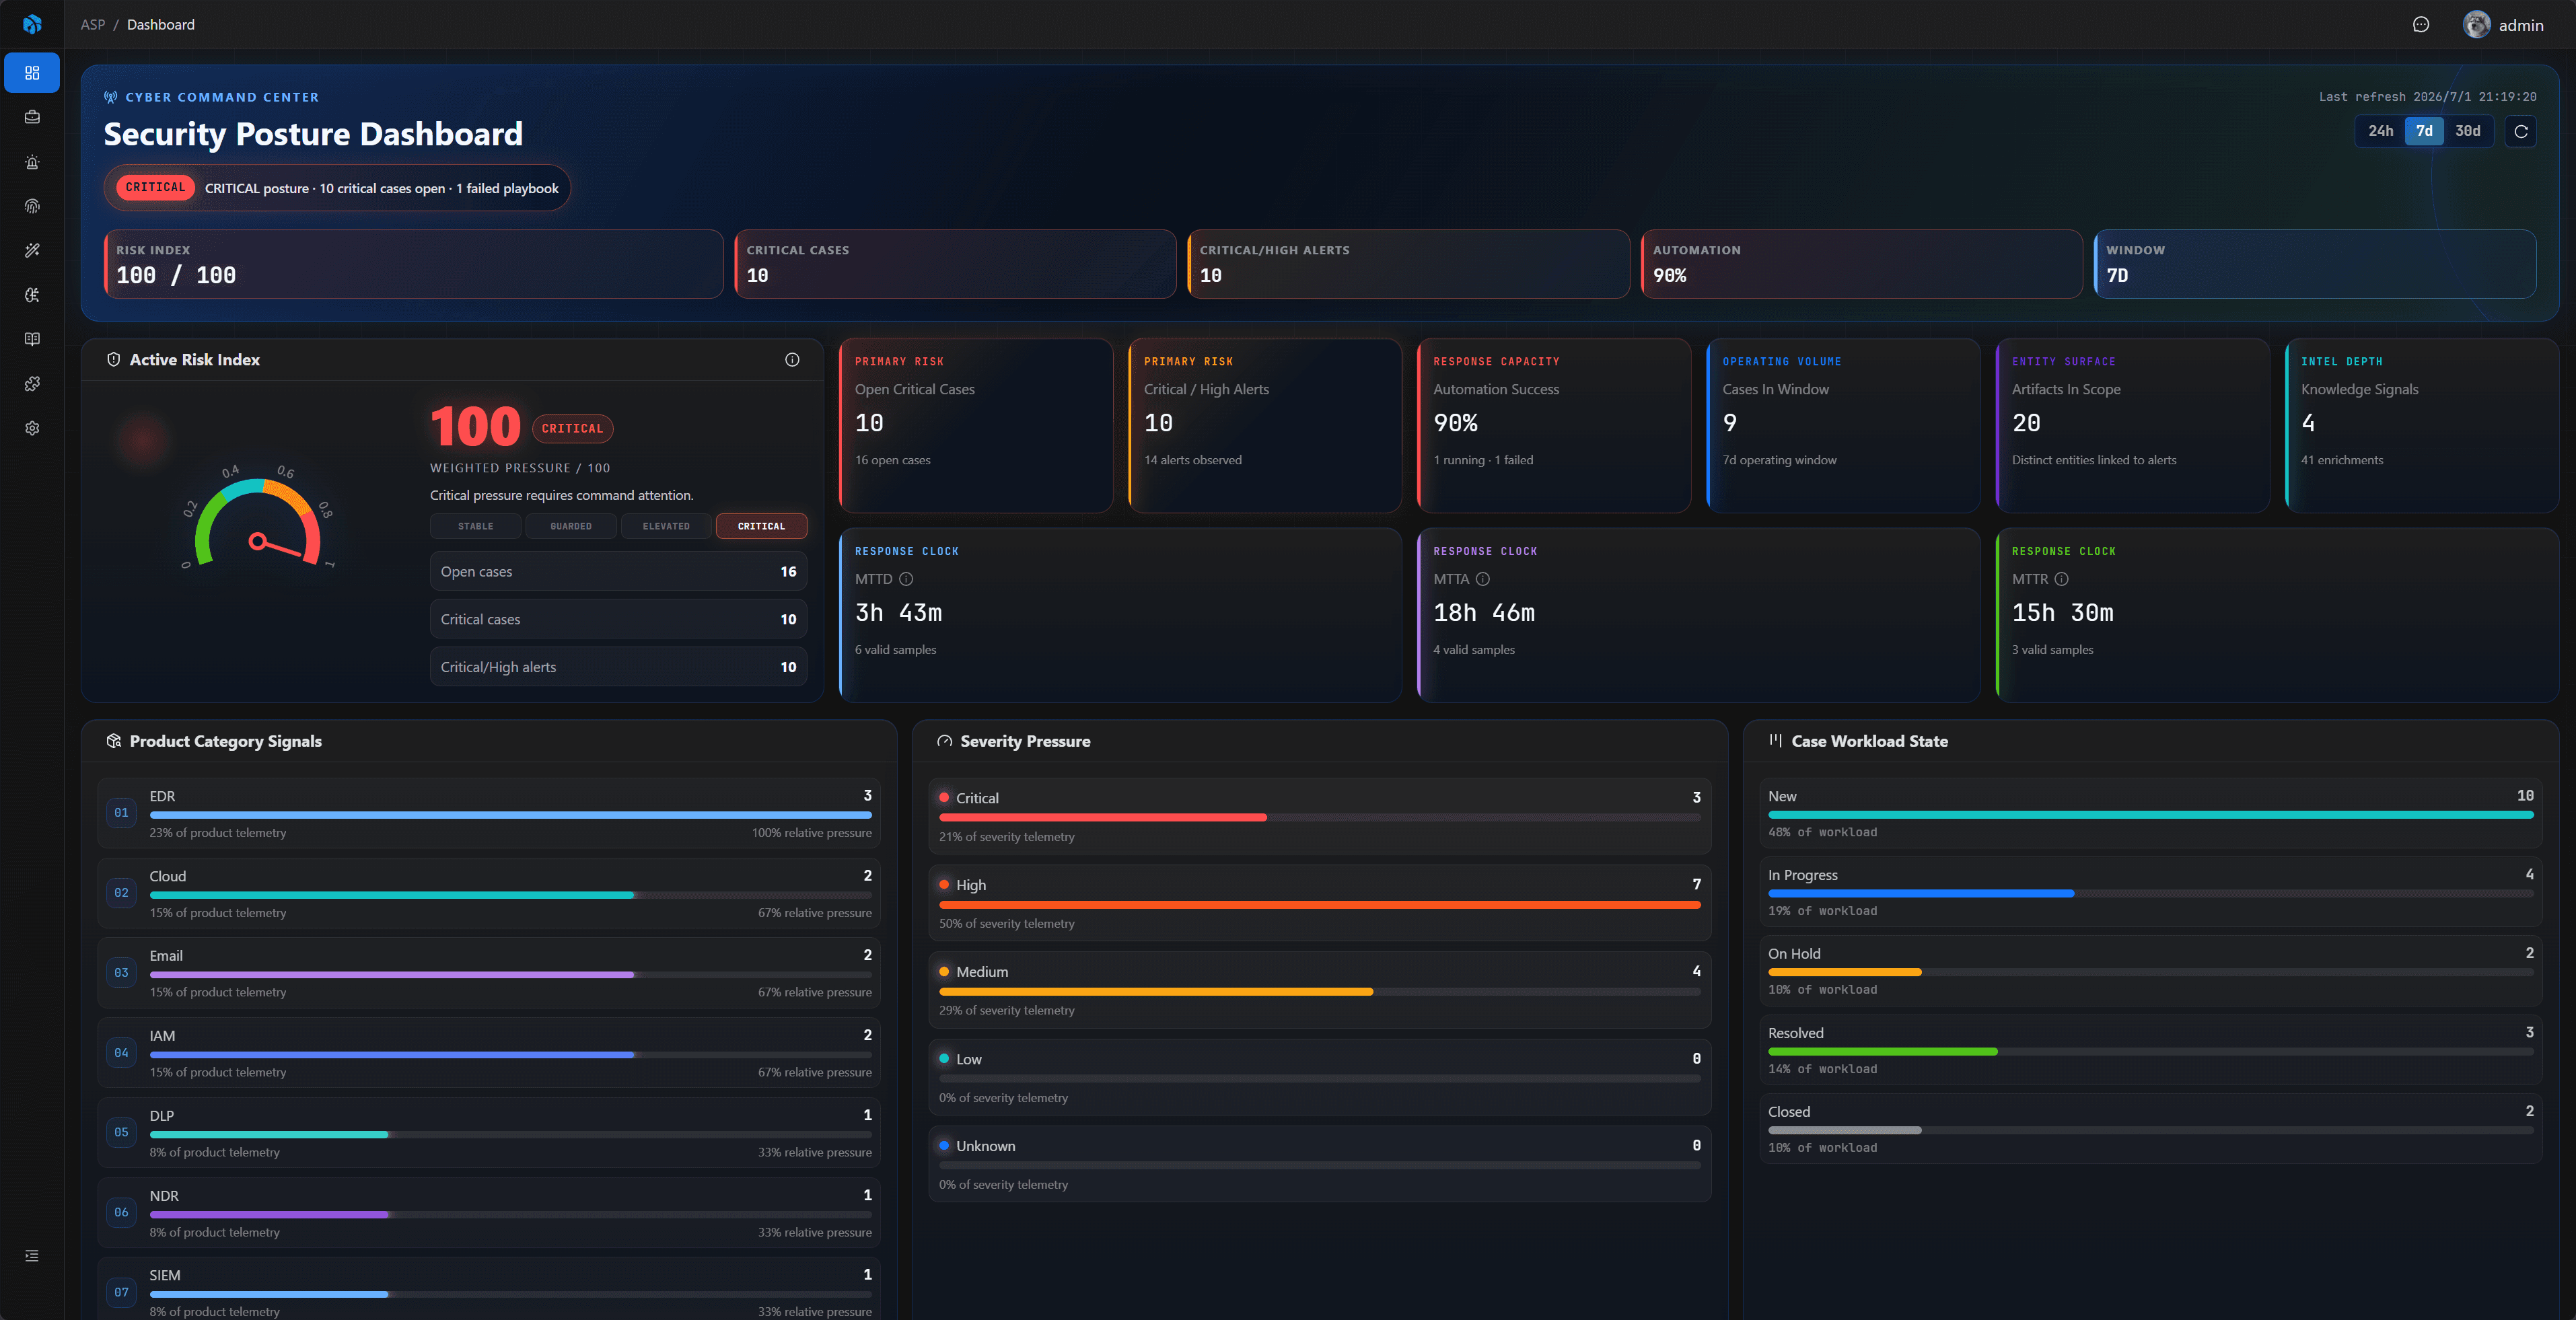
Dashboard is used to quickly view the current security operations status.
The current page aggregates and displays information such as Case, Alert, key trends, risk distribution, and keyword clouds, helping analysts determine which areas need priority attention today.
Data Refresh
Dashboard does not rerun every aggregation each time the page opens. asp-worker-dashboard-cache generates 24h, 7d, and 30d snapshots in the background and stores them in Redis. The page reads the latest successfully generated snapshot.
The page shows when the data was generated and requests newer snapshots using Dashboard Refresh Interval from Runtime. The default interval is 5 minutes.
If a snapshot is older than three refresh intervals, the page warns that the data is stale. On first startup, Dashboard temporarily returns 503 and reports that its cache is preparing until the worker generates the first snapshots.
Cache Troubleshooting
If Dashboard has no data for an extended period or keeps warning that data is stale, check the cache worker:
docker compose ps asp-worker-dashboard-cache
docker compose logs --tail=100 asp-worker-dashboard-cache
Confirm that the worker is running and completing refreshes for the 24h, 7d, and 30d windows. See Restart & Operations for complete operational commands.
Usage Recommendations
- Check Dashboard at the start of each shift.
- Focus on new Cases, severity levels, alert trends, and high-frequency keywords.
- When a stale-data warning appears, check the cache worker instead of treating the old snapshot as realtime data.
- Use Dashboard to determine whether to enter Case or Alert lists for further filtering.